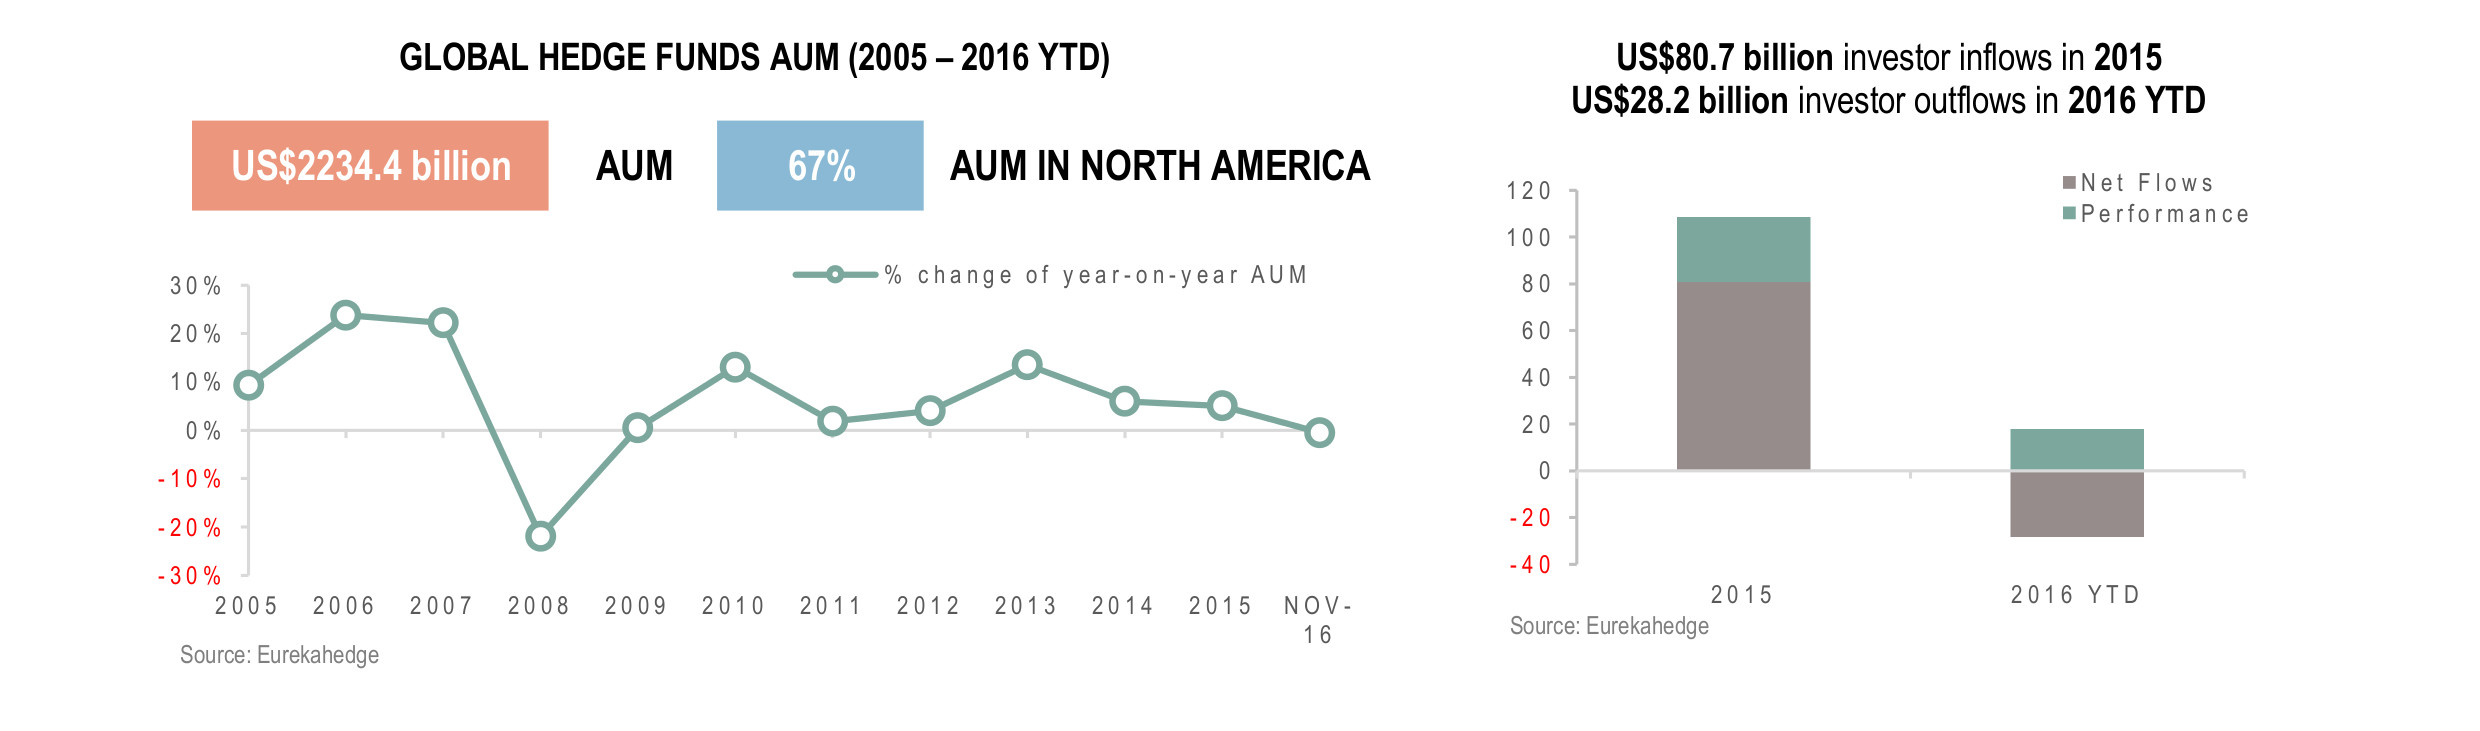
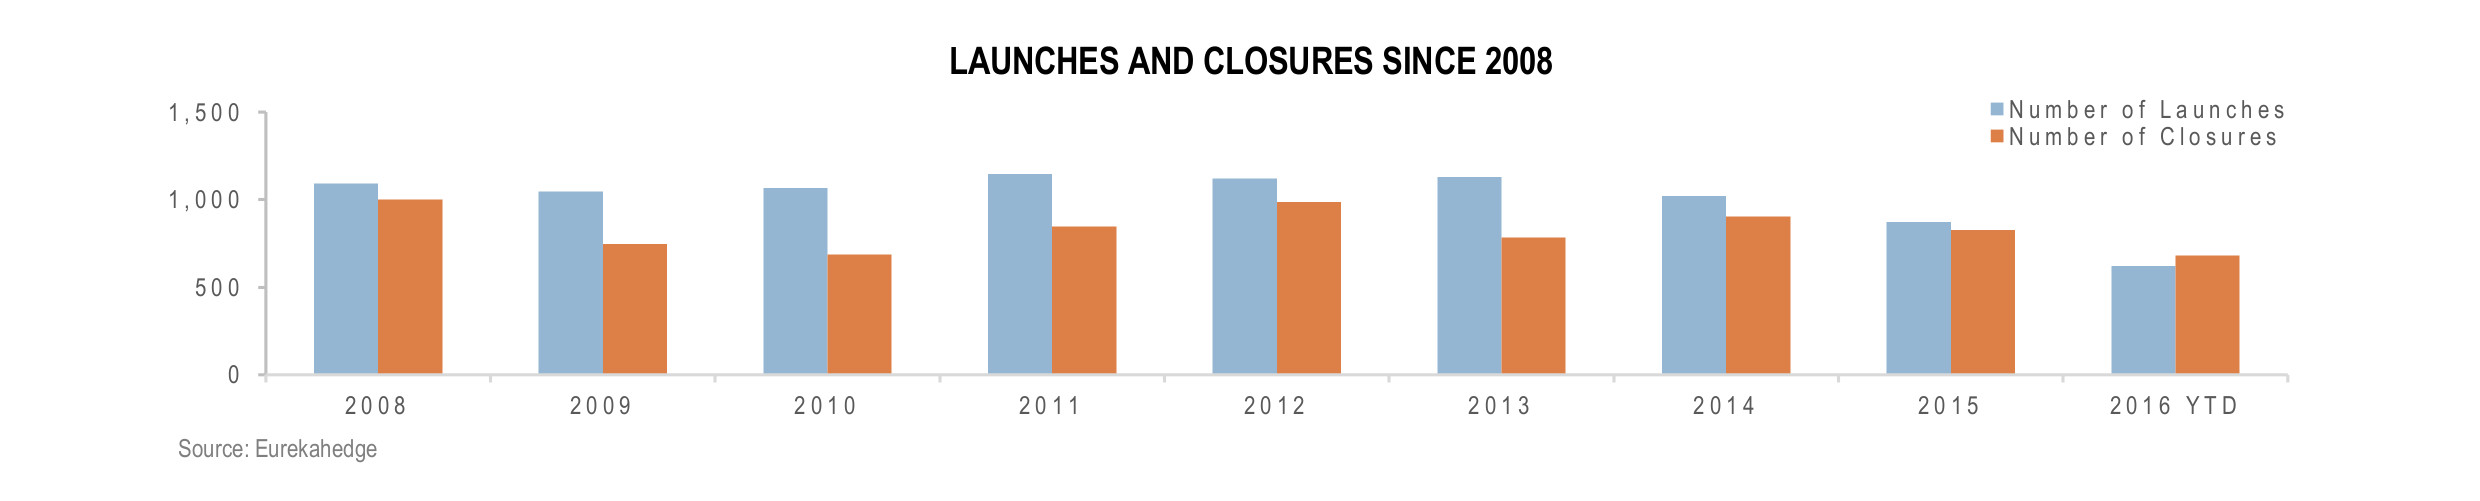
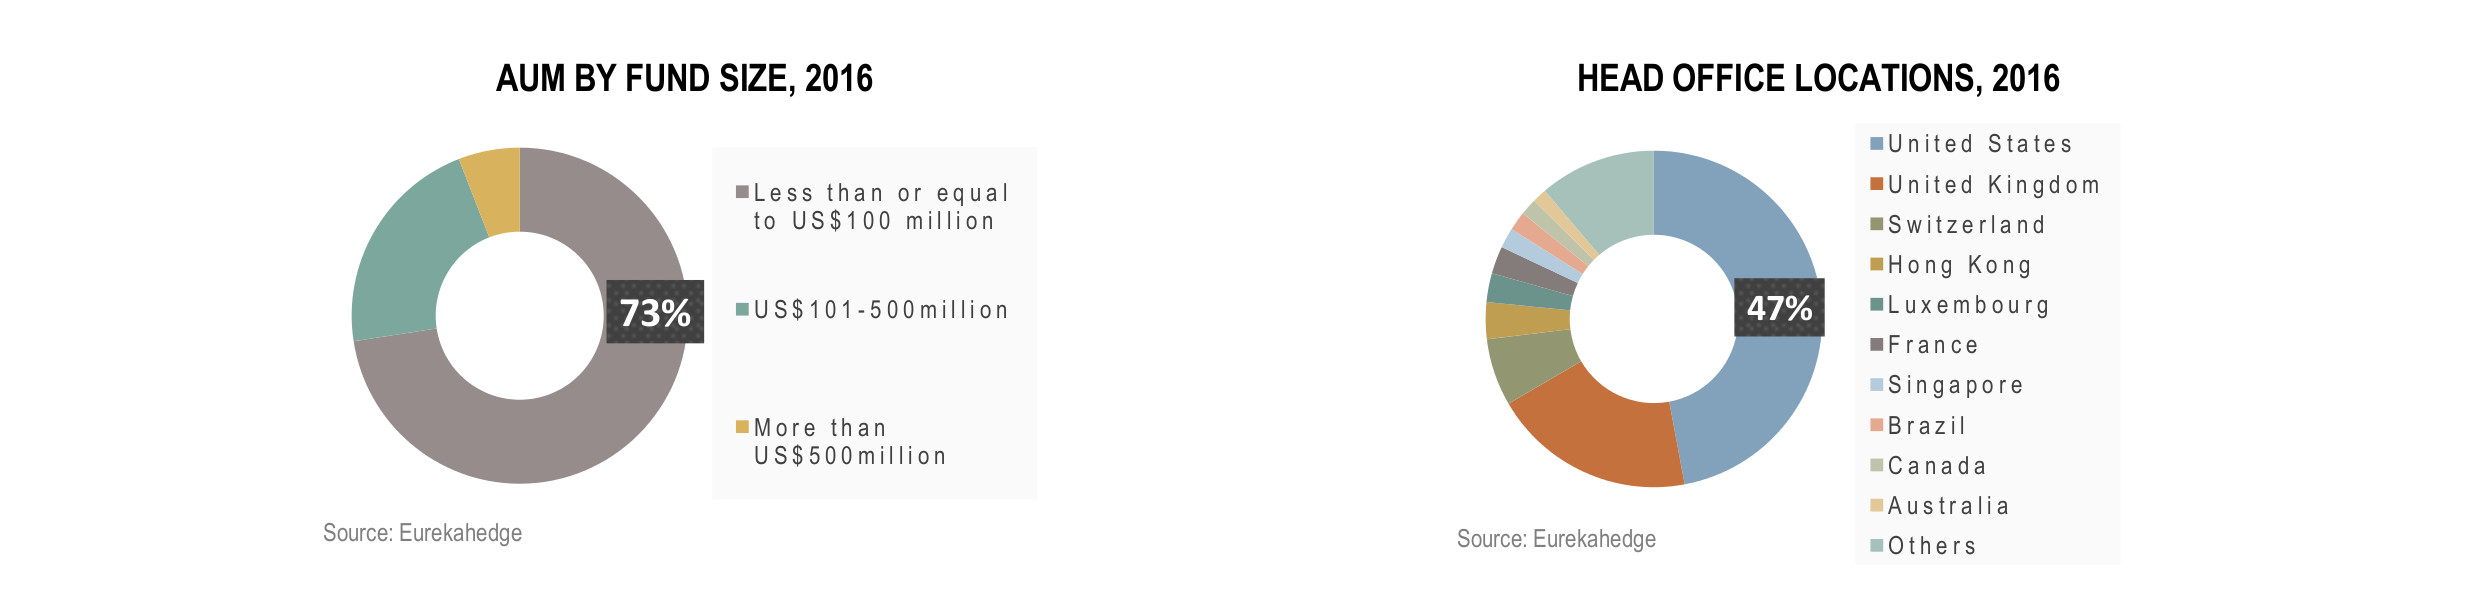
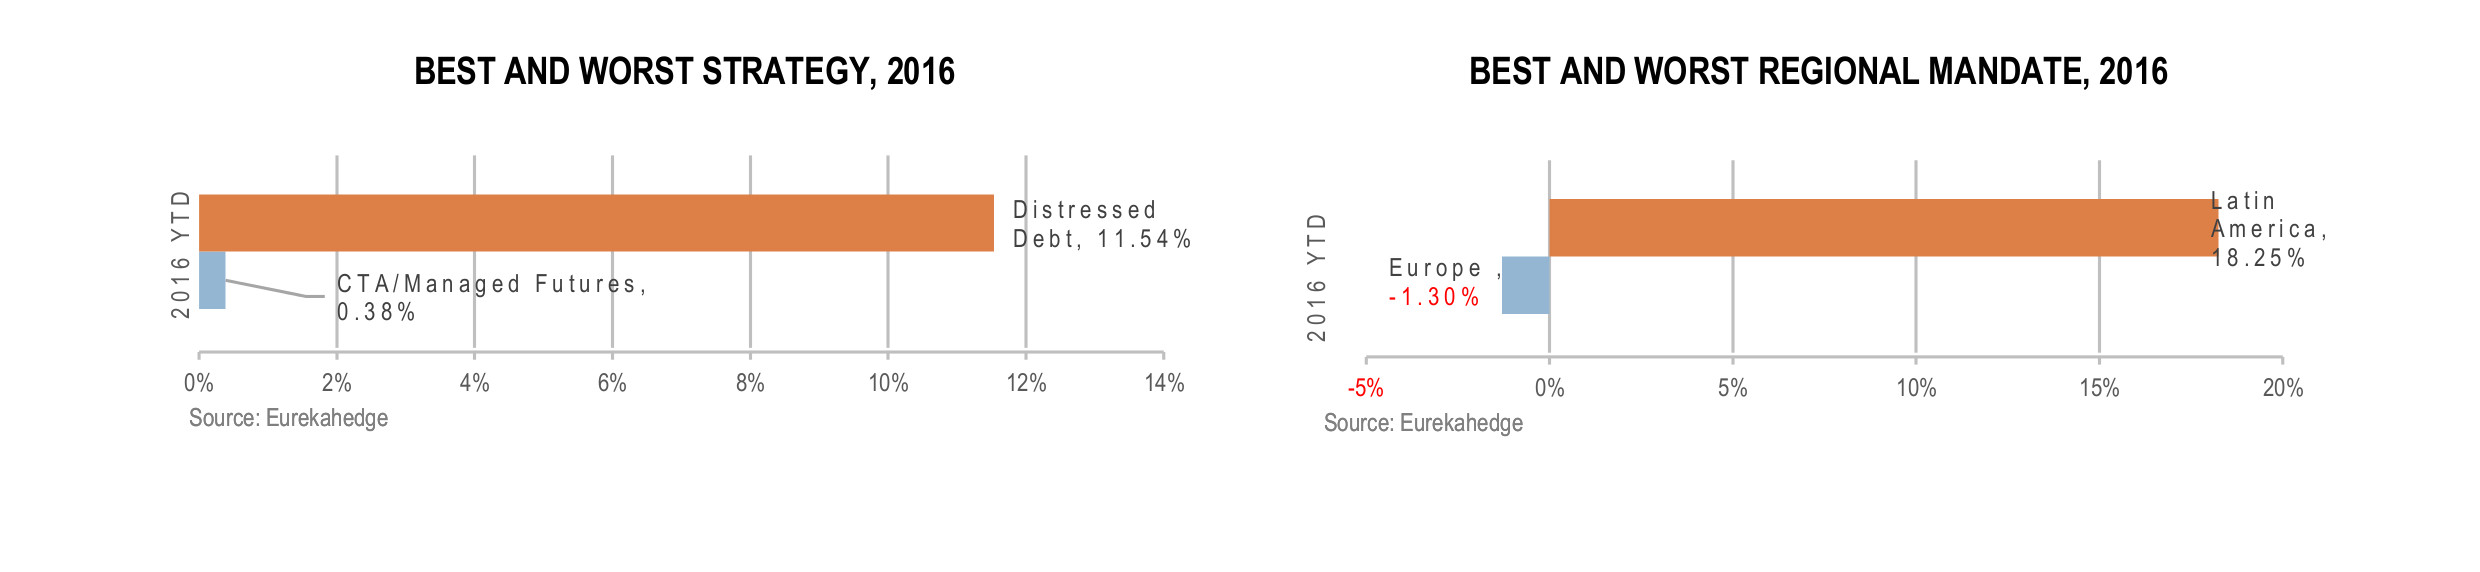
Eurekahedge’s global hedge funds infographic sums up the industry as at January 2017. Find out more about global hedge funds assets under management (AUM), asset flows into strategic and regional mandates, launches and closures, fund size, head office locations and the best and worst performances of the year.
This month, we also include a BONUS heat map covering the top hedge fund strategies over the years.